
A sediment granulometry approach to anthropogenic landscape impacts
Introduction
Sediment granulometry is the study of the size distribution of clasts in sediments. There is a well-understood relationship between fluxes in the energy of wind and water flow and the detachment, entrainment, and subsequent deposition of particles of different sizes. Granulometry is commonly used in sedimentological approaches to understanding past depositional environments, but has rarely been used in geoarchaeological approaches to understanding human impacts on depositional processes. Here, we detail a granulometry approach combined with Optically Stimulated Luminescence (OSL) dating to understanding past human land-use impacts during the Iron Age through Medieval periods on sediment deposition on a small alluvial fan in southeast Kazakhstan.
Study region
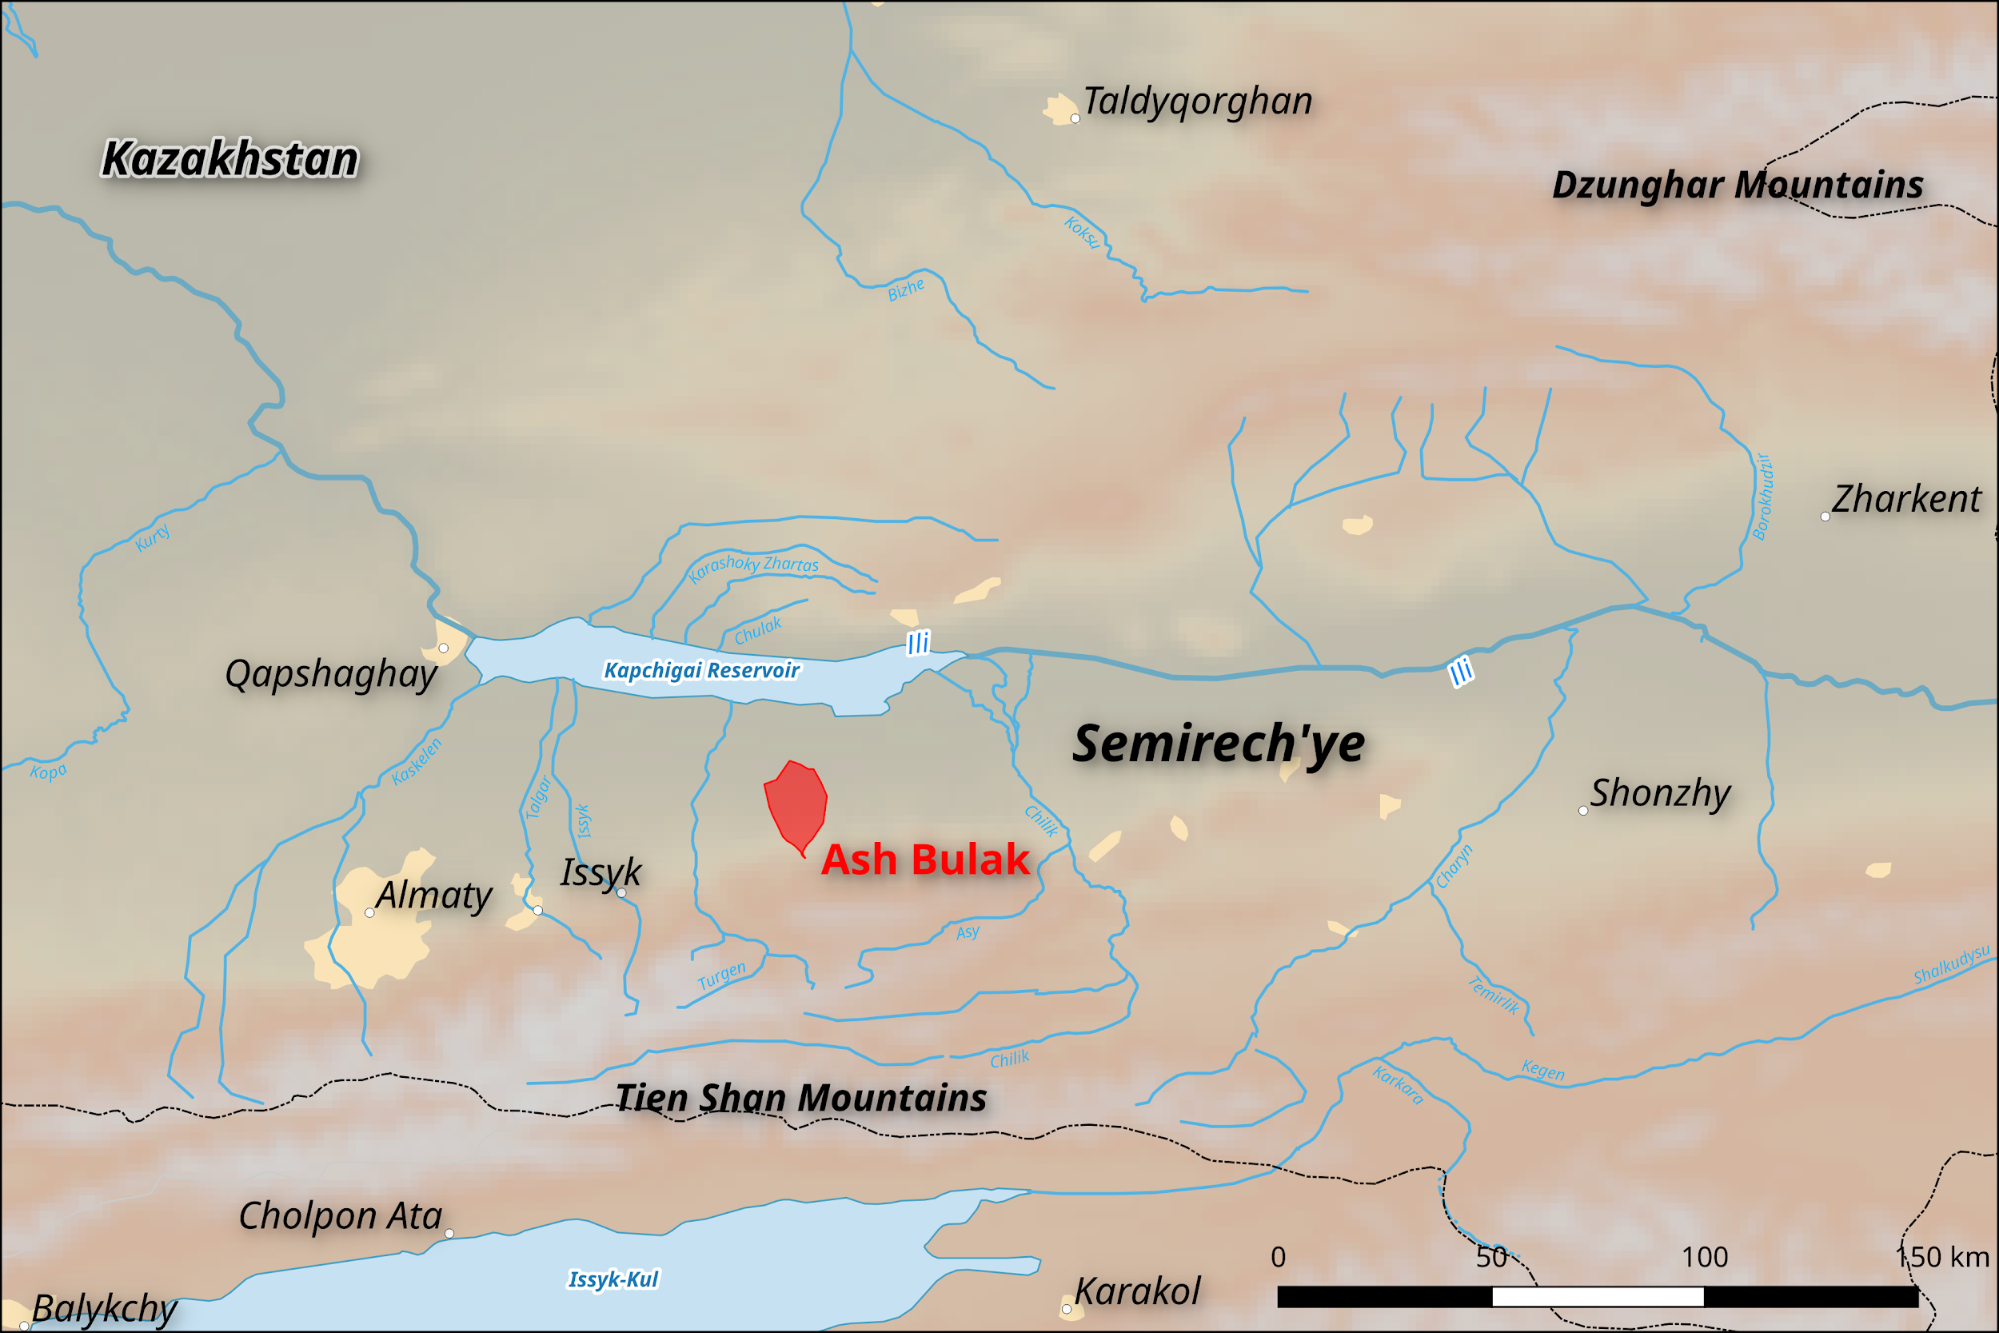
Ash Bulak is a small alluvial fan and perennial stream about 75 km east of Almaty in the Semirech’ye (land of the seven rivers) region of southeastern Kazakhstan (Figure 1). It is one of thirty alluvial fans between Almaty and the Chinese border that have formed along the front range of the Tian Shan mountains. The mountain rivers that form these fans drain into the Ili River that flows east to west across a wide interior basin that stretches from Western China to the Kapshagay reservoir. The Ili River eventually drains northwest to Lake Balkash.</span></p><p class="c20">Decades of archaeological research on the nearby Talgar and Issyk alluvial fans have uncovered intensive, sedentary, and semi-sedentary agropastoral land-use stretching back at least through the Early Iron Age (ca. 800 BCE) (Chang, 2018), and perhaps as far back as the Middle Bronze Age (2250 BCE) (Ullah et al., 2019). Smaller in area, the Ash Bulak fan has been less disturbed by mechanized agriculture in the post-Soviet period. Pedestrian survey in the 2014 and 2017 field season of the Kazakh-American Archaeological Project (KAAP) recorded dozens of burial features (kurgan mounds and other tomb structures) and residential features,including a large _tortkul (fort) laid out along the banks of the Ash Bulak stream. The stream is currently downcutting, exposing many good erosional cuts into the older floodplain sediments. It therefore provides an excellent opportunity to collect sediment samples from multiple profiles for granulometric analysis.
Sampling Method
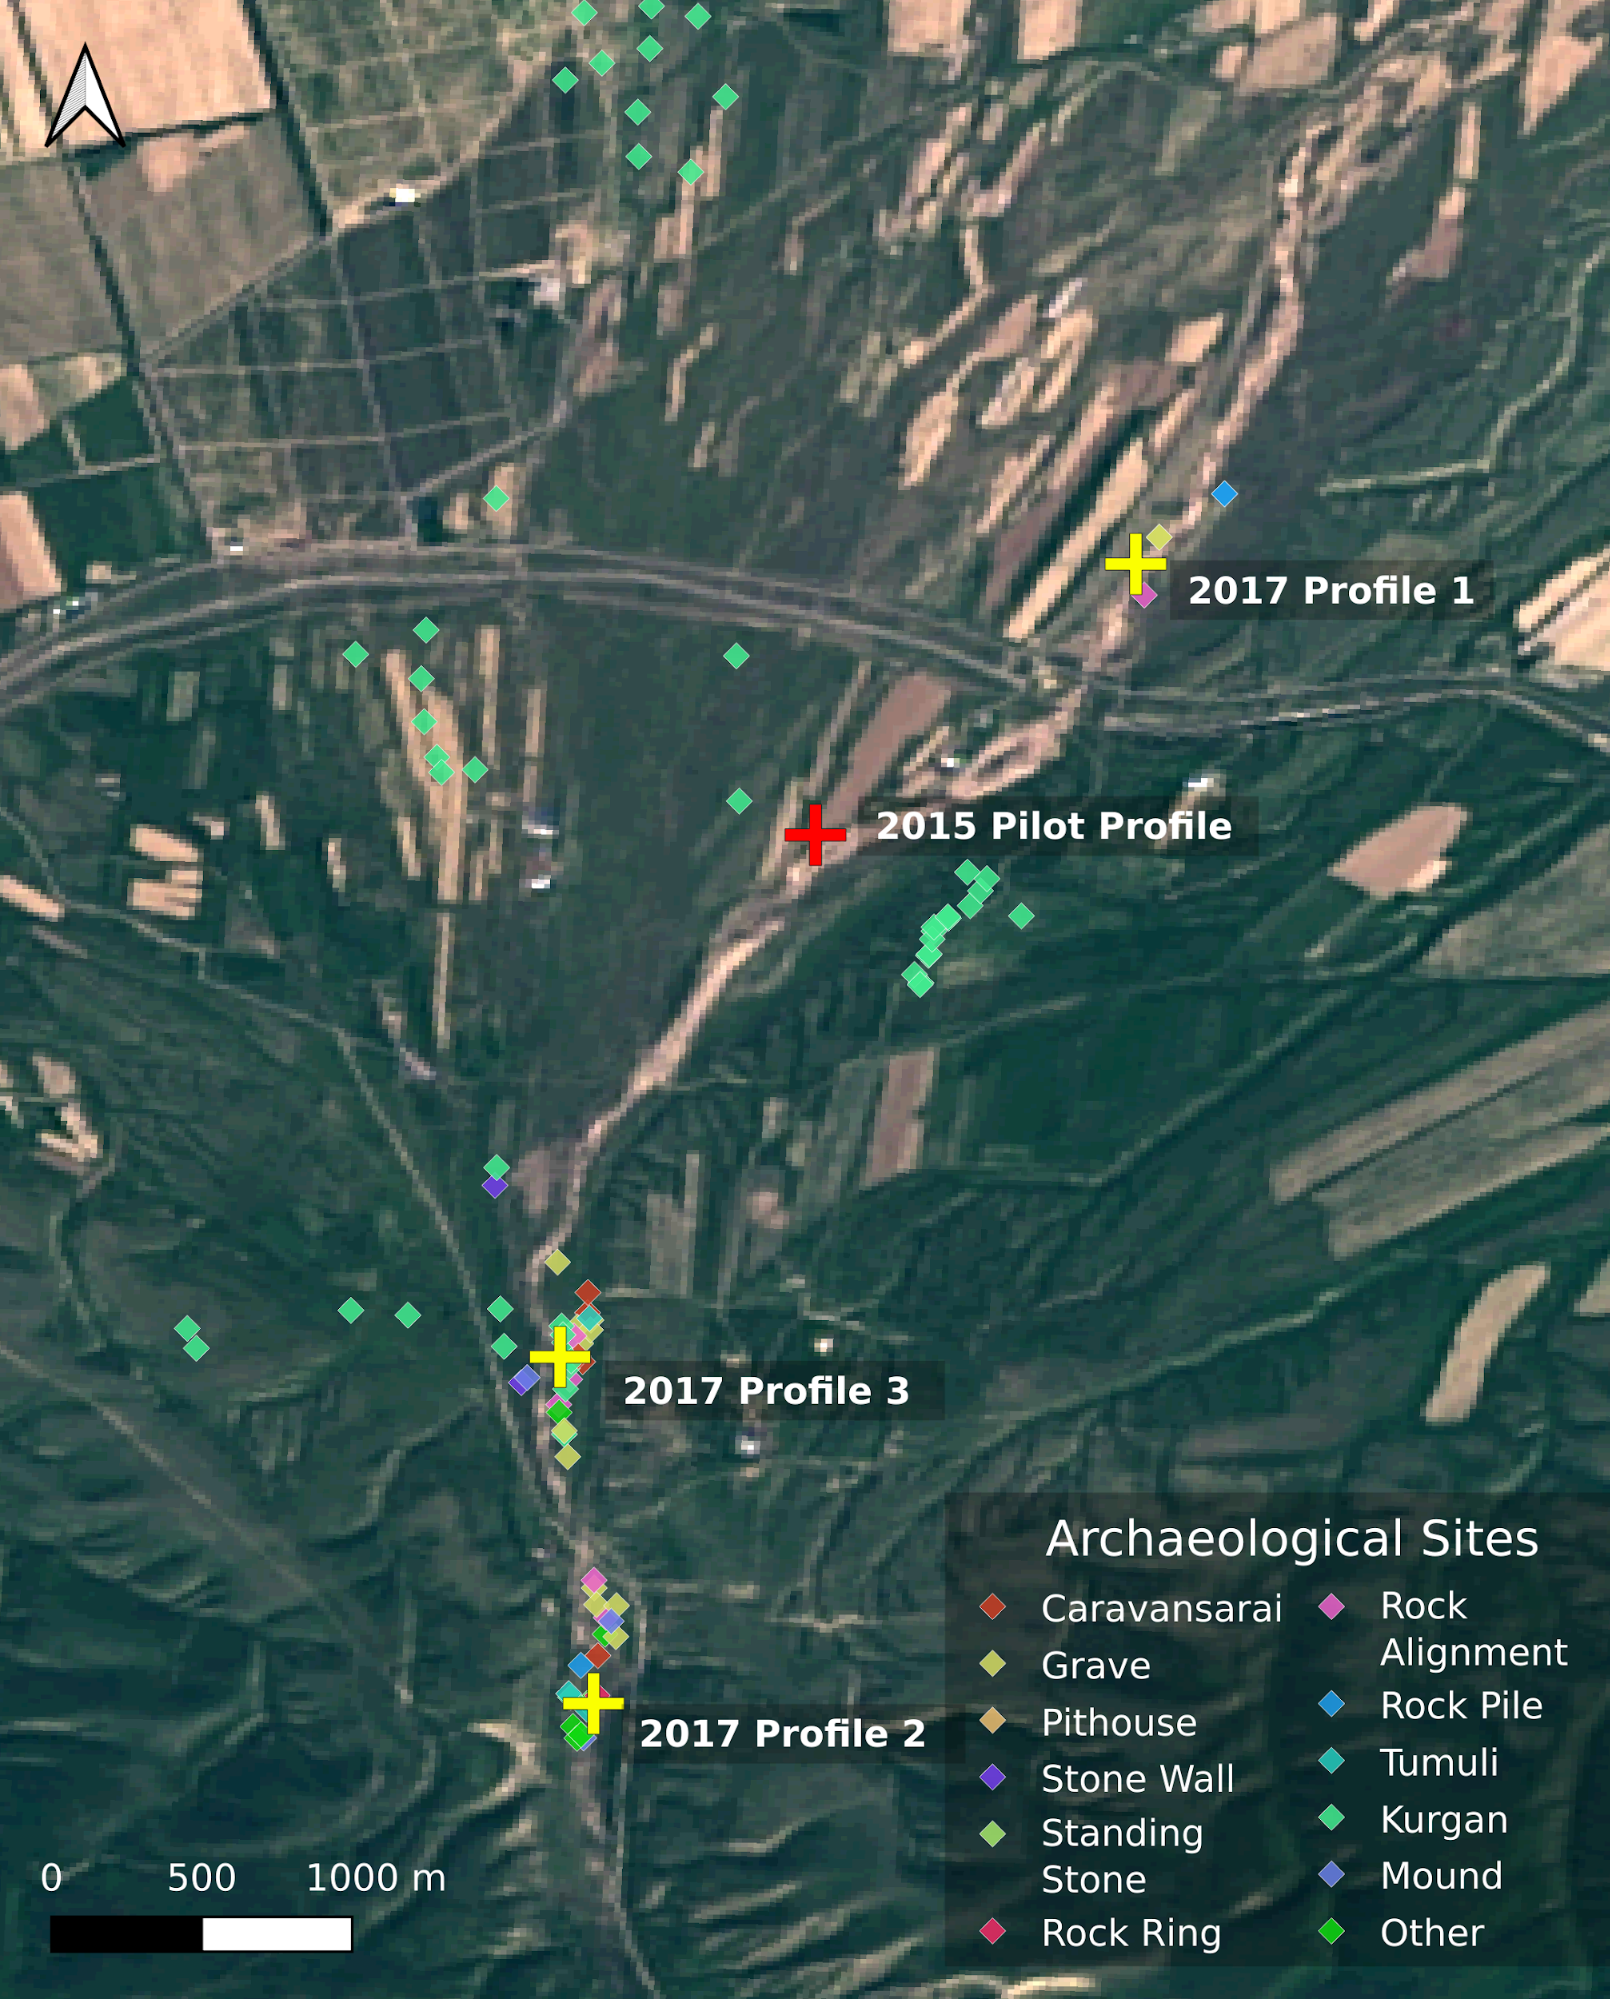
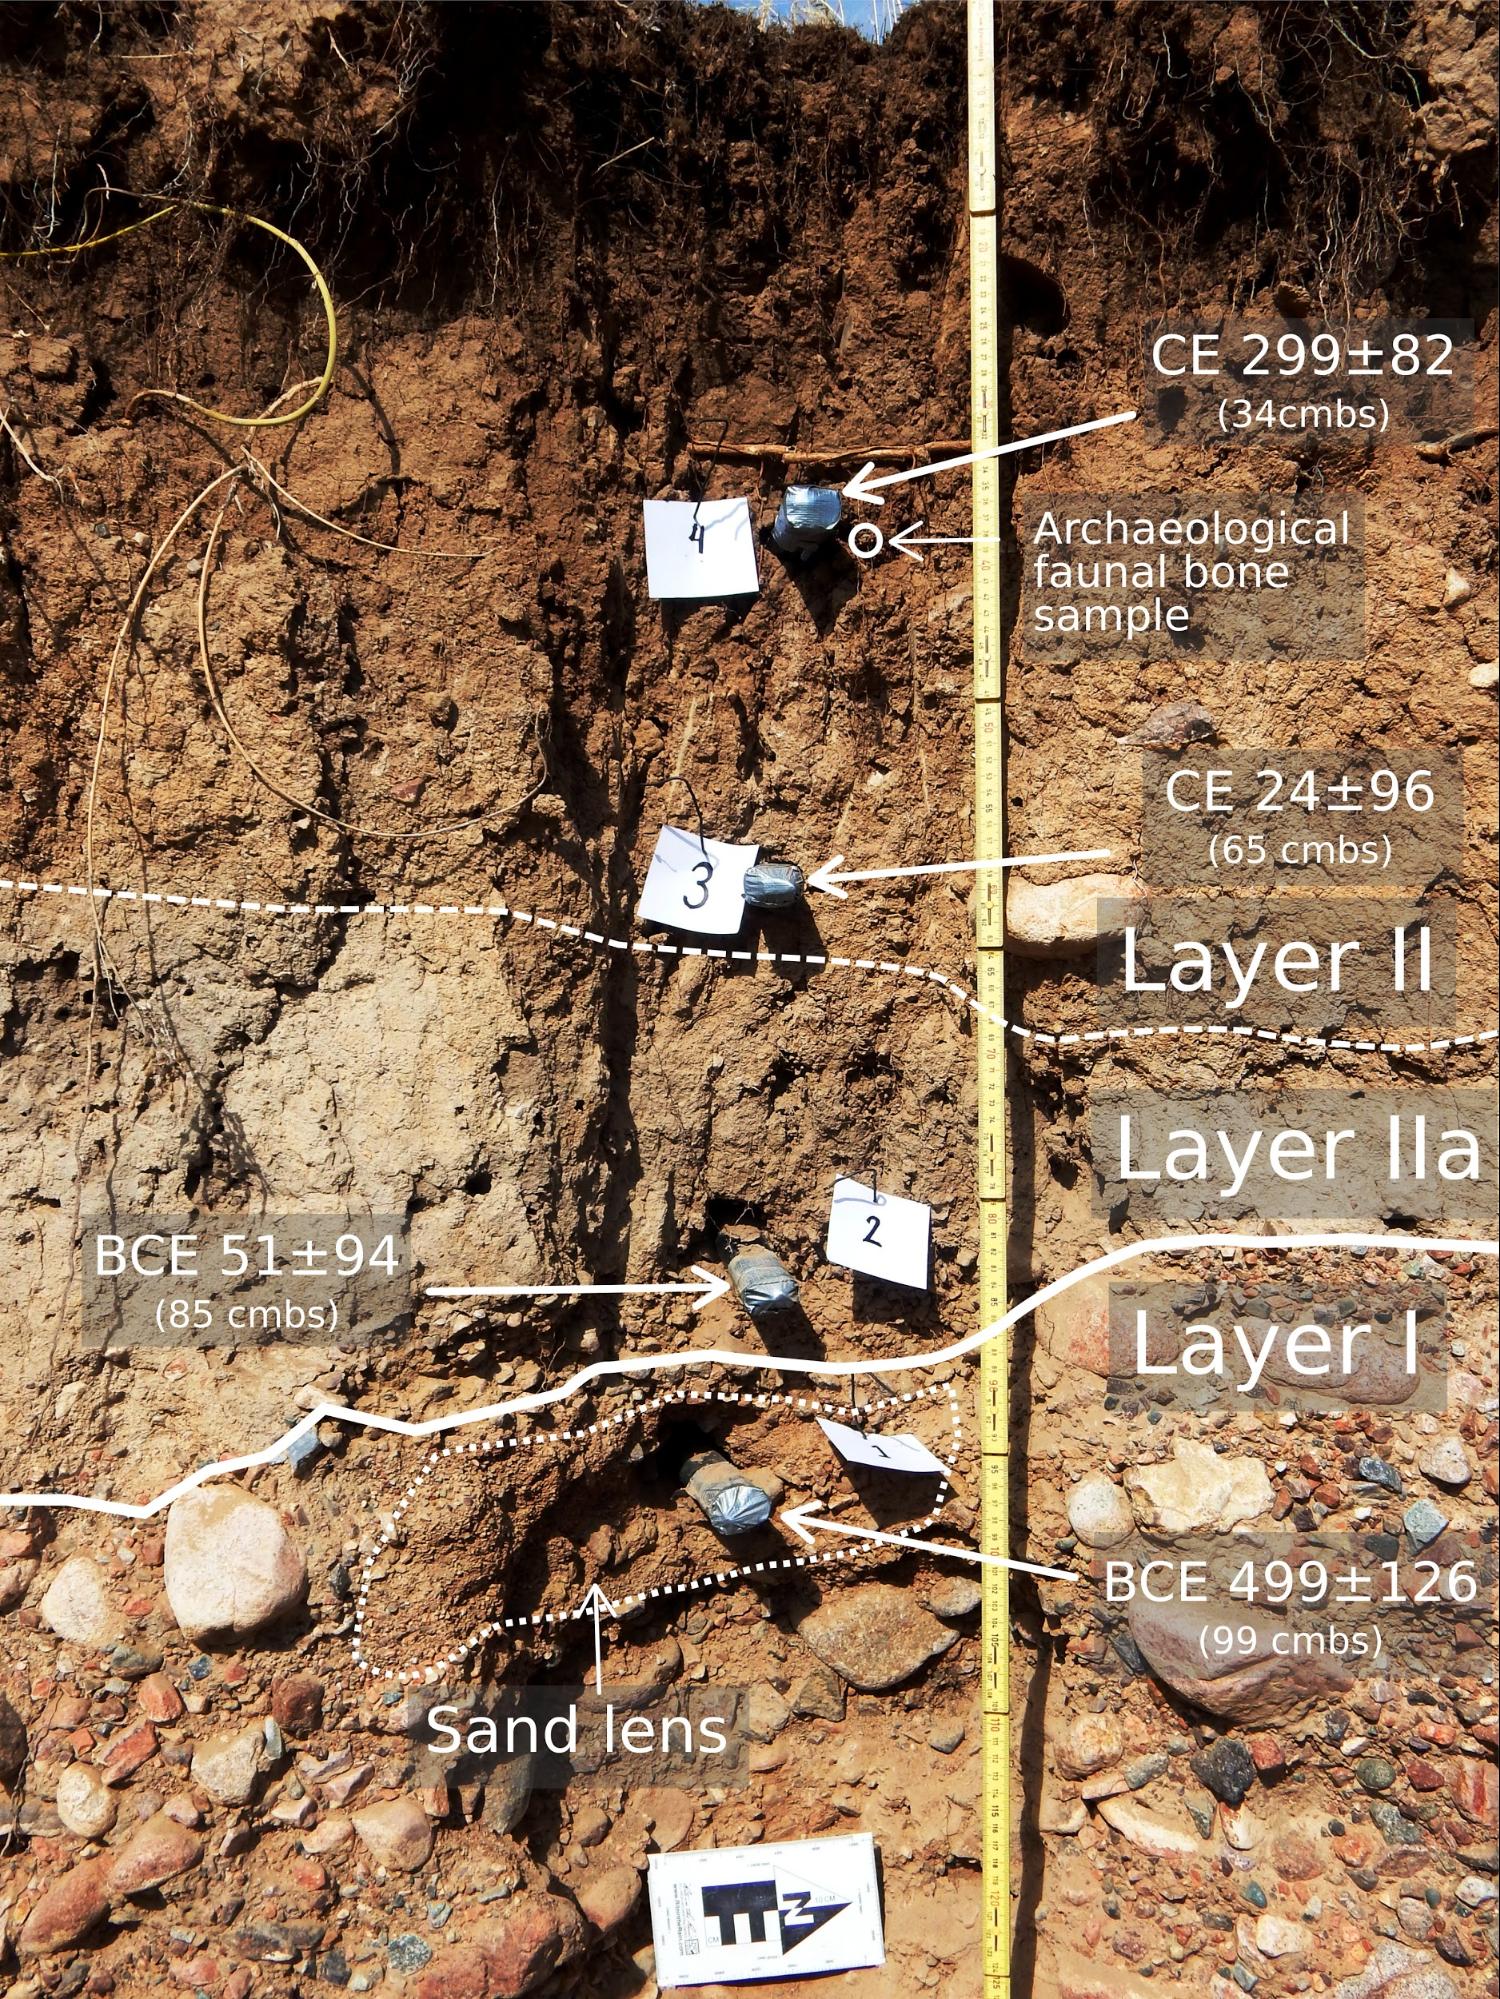
A pilot survey in 2015 identified visible artifacts along a section of the erosional bank in the middle stretch of the fan. We selected a single sedimentary profile to test the efficacy of OSL dating in the region. In 2017 we returned to conduct a systematic pedestrian survey, which identified patterns of agropastoral land-use in the study area. We then identified three new sedimentary profiles up- and downstream from the 2015 profile for additional OSL dating and for granulometry studies. In both seasons, profiles were cleaned back by ~20cm, and the stratigraphy was recorded before samples were collected. A common stratigraphic boundary at about 0.7 to 1.1 meters below the current surface was observed at each profile between an upper set of fine-grained units, and a lower, highly indurated set of cobble-rich units. We collected 3 horizontal cores of sediment in light-tight metal tubes at varying depths within the fine-grained strata at each profile. We also collected one OSL sample from the cobble-rich unit at the 2015 pilot profile.
OSL Method
OSL dating samples were extracted from the center portions of the sample tubes in a dark room to avoid exposure to light at the IIRMES laboratory at CSU Long Beach. These samples were processed and analyzed using a coarse-grained (90-125 µ) quartz protocol. Extracted sediment samples were crushed using mortar and pestle and then treated with hydrochloric acid and hydrogen peroxide to remove carbonates and organics. The 90-125 μm size fraction was then separated via sieve, and quartz particles were extracted by the different densities of sodium polydentate. The recovered quartz particles were etched with hydrofluoric acid and then placed on disks for luminescence reading. A Risø TL/OSL Reader with blue-light (BOSL) and infrared (IROSL) stimulation was used with a single-aliquot regeneration sequence (SAR) protocol to evaluate the rate of luminescence signal accumulation (equivalent dose) of each sample. Dosimeric information (background radiation dose rates) were assessed using LA-ICP-MS (thorium and uranium) and p-XRF (potassium). Ages for each of 30-50 aliquots per sample were then determined based on the equivalent doses and dosimetric information. Only equivalent doses that passed the criterial test were used for the age calculation. The final age determinations are based on the average of the dates for each sample with a central age model for all samples with overdispersion rates. The error term was also calculated as error(ka)/age (Ka).
Granulometry Method
We conducted a particle size distribution analysis on the portions of sediment (~130 to 180g) remaining in the 2017 samples after OSL analysis. The distribution of sand size classes were assessed through sieving for 3 minutes via a mechanical shaker fitted with a standard set of geological sieves in Udden-Wentworth mesh sizes between 64μm and 20mm. The fractions from all sieves larger than 4mm were lumped into a single “gravel” size class as clasts larger than 8mm were extremely rare. We calculated a cumulative distribution of size classes as percentage of total sample mass. In a future step, we will use a Beckman Coulter Multisizer 3 Particle Size Analyzer to analyze the silt and clay size fractions. The Coulter method senses particles suspended in an electrolyte (for sediments, a 10% (w/v) sodium chloride solution) passing through an aperture of known diameter in proximity to an electrode. The method can detect size ranges related to the diameter of the aperture, and can count individual particles of different sizes within the detection limit for the fitted aperture. We will use a 100μm and 20μm apertures to collect particle size distributions in the 64μm to 2μm range. These data will be combined with those derived from mechanical sieving to create a Particle Size Distribution curve of Udden-Wentworth sizes between colloidal clay and grave
Preliminary OSL Results
OSL results from the 2015 pilot profile place the boundary of the lower cobble units and the upper fine-grained units between 499 (+-126) BCE and 51 (+-914) BCE, and confirms the unconformal nature of the contact. Using the central age model for each of the three OSL dates from the upper fine-grained unit, we calculate an overall average deposition rate of approximately 1.9 mm/y over a period of ~350 years. The deposition rate appears to decrease over time from an average rate of 2.6 mm/y between 51 BCE and CE 24 to an average rate of 1.13 mm/y between CE 24 and CE 299. If rates of deposition remained similar after CE 299, the current surface likely dates to between CE 478 and CE 600. This may then also be the timeframe when the Ash Bulak stream began to downcut into its current incised configuration. OSL results from the 2017 season are forthcoming.
Preliminary Granulometry Results
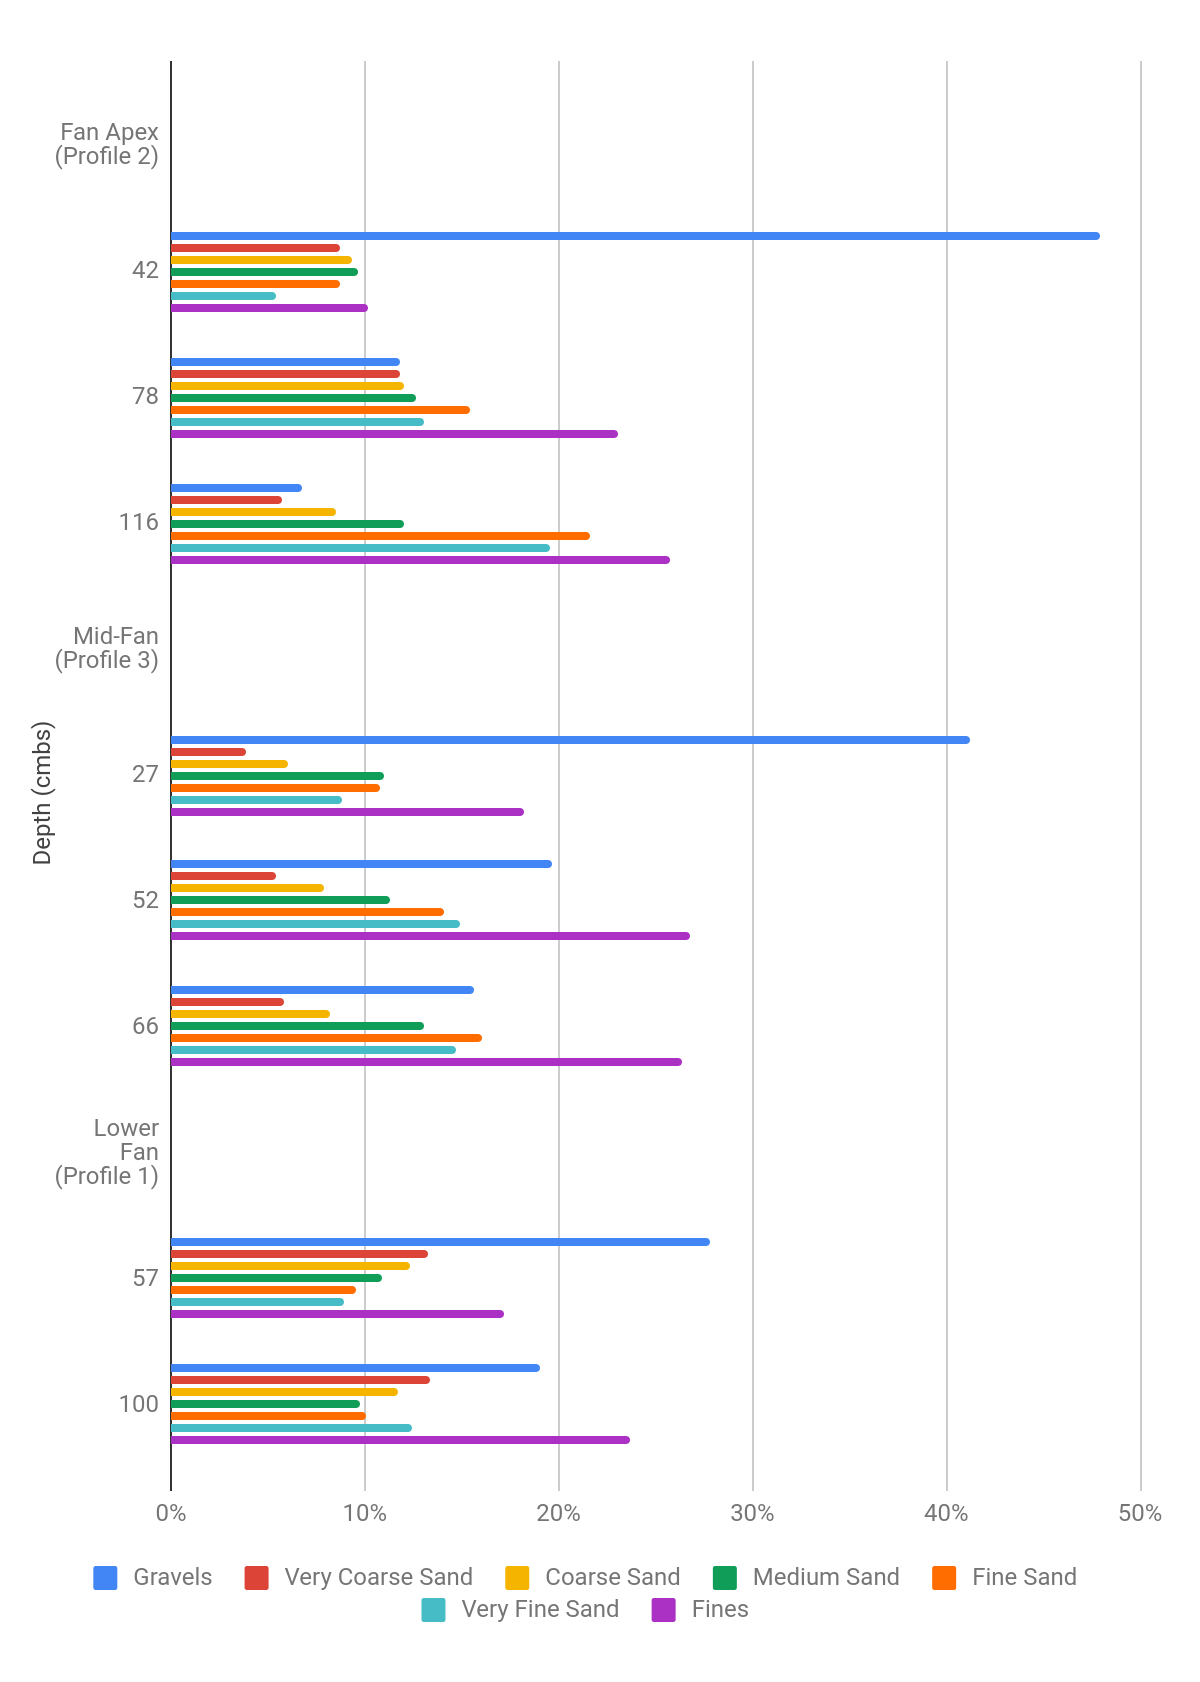
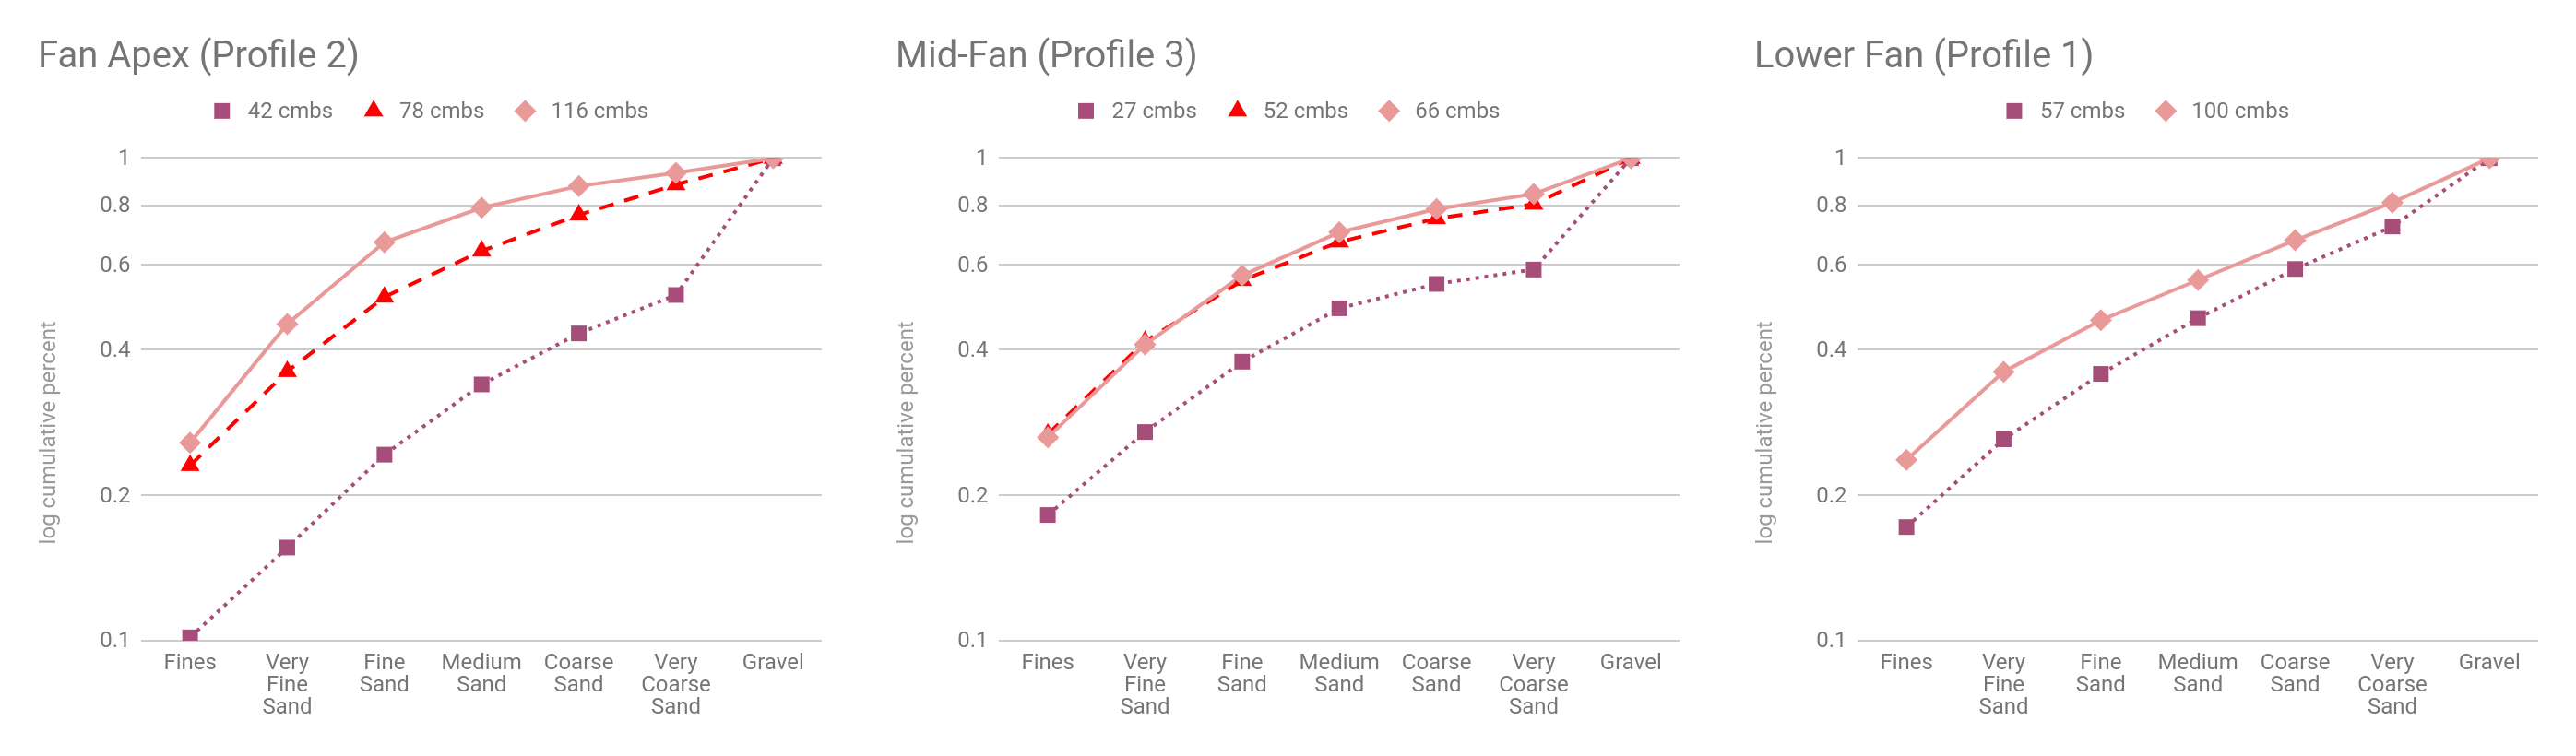
The results from mechanical sorting of the sands along with the bulk weight of the fines and gravels provide initial particle size distributions in percentage of total sample weight for each of the sampled depths at each of the 2017 profiles (Plot 1). The distributions show how the frequencies of the different clast sizes in the upper fine-grained member change with depth from near the apex of the fan (Profile 2) through the middle of the fan (Profile 3) to the lower part of the fan (Profile 1). At all three locations, there is a pronounced coarsening-up sequence showing addition of gravels over time. The particle size distributions can also be viewed as cumulative frequency curves (Plot 2). The overall shape of these curves, including “peaks” and inflection points, illustrate typical energistic characteristics of the depositional environment. Near the fan apex, the curve flattens with the inverse of depth indicating an overall increase in energy over time. In the mid and lower fan, the shape of the curves remains similar regardless of depth (except for the gravel sizes), suggesting that average depositional energy remained generally similar over time
Discussion
Macklin’s et al. (2015) study of the Holocene sedimentation dynamics of the nearby Talgar river indicates a period of relative climatic and sedimentation stability between ~410 BCE and CE 1550, which was preceded by a wet/cool period of sediment aggradation from 910 to ~410 BCE. Our analyses at Ash Bulak indicate that there was considerable smaller-scale sedimentation variability within these larger temporal units. First, a previously-unaccounted-for erosive episode exists sometime after 499 BCE, but before 51 BCE – most likely around 400 BCE. Third, sedimentation rates at Ash Bulak begin to decrease near the end of the Talgar Iron Age Phase 2 (200 BCE to CE 1 or CE 100). Fourth, although we are still waiting on OSL determinations from the 2017 profiles, if their age-depth models generally match that of the 2015 pilot profile, then this change in sedimentation rate is accompanied by a coarsening up sequence. Fifth, somewhere between CE 24 and CE 299, sedimentation rates decreased. This was accompanied by an increase in depositional energy at the apex of the fan with greater transport of gravels across the fan. These findings may be the signature of initial Iron-Age agropastoral landscape modification via check dams and low-level irrigation depositing alluvial re-worked loesses, followed by longer-term changes in irrigation or land-use intensity in the Wusun and Turkic periods. The Turkic period has been considered a period of much lower population density in the region. These changes in sedimentation rates occur during a period of what appears to be general climate stability, lending further credence to the hypothesis that sedimentation dynamics in this period were driven more by human land-use than by climate change.
Conclusions
Here, we have shown the preliminary efficacy of sediment granulometry combined with OSL dating to elicit fine-scale changes in sedimentation rates and depositional energy that may be indicative of human land-use within otherwise stable climatic conditions. We have documented a previously unknown erosional episode at ~400 BCE in this region, followed by a ~500 year period of deposition of fine-grained sediment that may be related to changes in human land-use patterns. We await the final OSL dates from the 2017 samples, and the opportunity to quantify the particle size distribution in the silt and clay size fractions. We anticipate that these will strengthen the preliminary conclusions presented here.
Acknowledgements
We thank numerous field and laboratory personnel and our Kazakh colleagues who helped make this work possible. Work was funded by the National Science Foundation and an internal grant from San Diego State University.
Citation:
Ullah, I.I.; Piel, D.; Sakai, S.; Chang, C.; and Tourtellotte, P. 2021 “A sediment granulometry approach to anthropogenic landscape impacts.” Poster presented a the 2021 Society for American Archaeology Meetings. April 15-19, 2021 (online)
Works Cited
- Chang C (2018) Rethinking Prehistoric Central Asia: Shepherds, Farmers, and Nomads. Routledge, New York
- Macklin MG, Panyushkina IP, Toonen WHJ, Chang C, Tourtellotte PA, Duller GAT, Wang H, Prins MA (2015) The influence of Late Pleistocene geomorphological inheritance and Holocene hydromorphic regimes on floodwater farming in the Talgar catchment, southeast Kazakhstan, Central Asia. Quaternary Science Reviews 129:85–95
- Ullah IIT, Chang C, Tourtellotte P (2019) Water, dust, and agro-pastoralism: Modeling socio-ecological co-evolution of landscapes, farming, and human society in southeast Kazakhstan during the mid to late Holocene. Journal of Anthropological Archaeology 55
Leave a comment